Without proper visibility, you’re flying blind, unable to tell when your LLM model hallucinates, why latency spikes, which prompts are draining your token budget or whether a prompt injection is quietly manipulating your outputs. As AI-powered applications move into production at scale, this gap is a security and compliance risk.
LLM observability tools let you trace every request, evaluate output quality, track costs and catch failures before your users do.
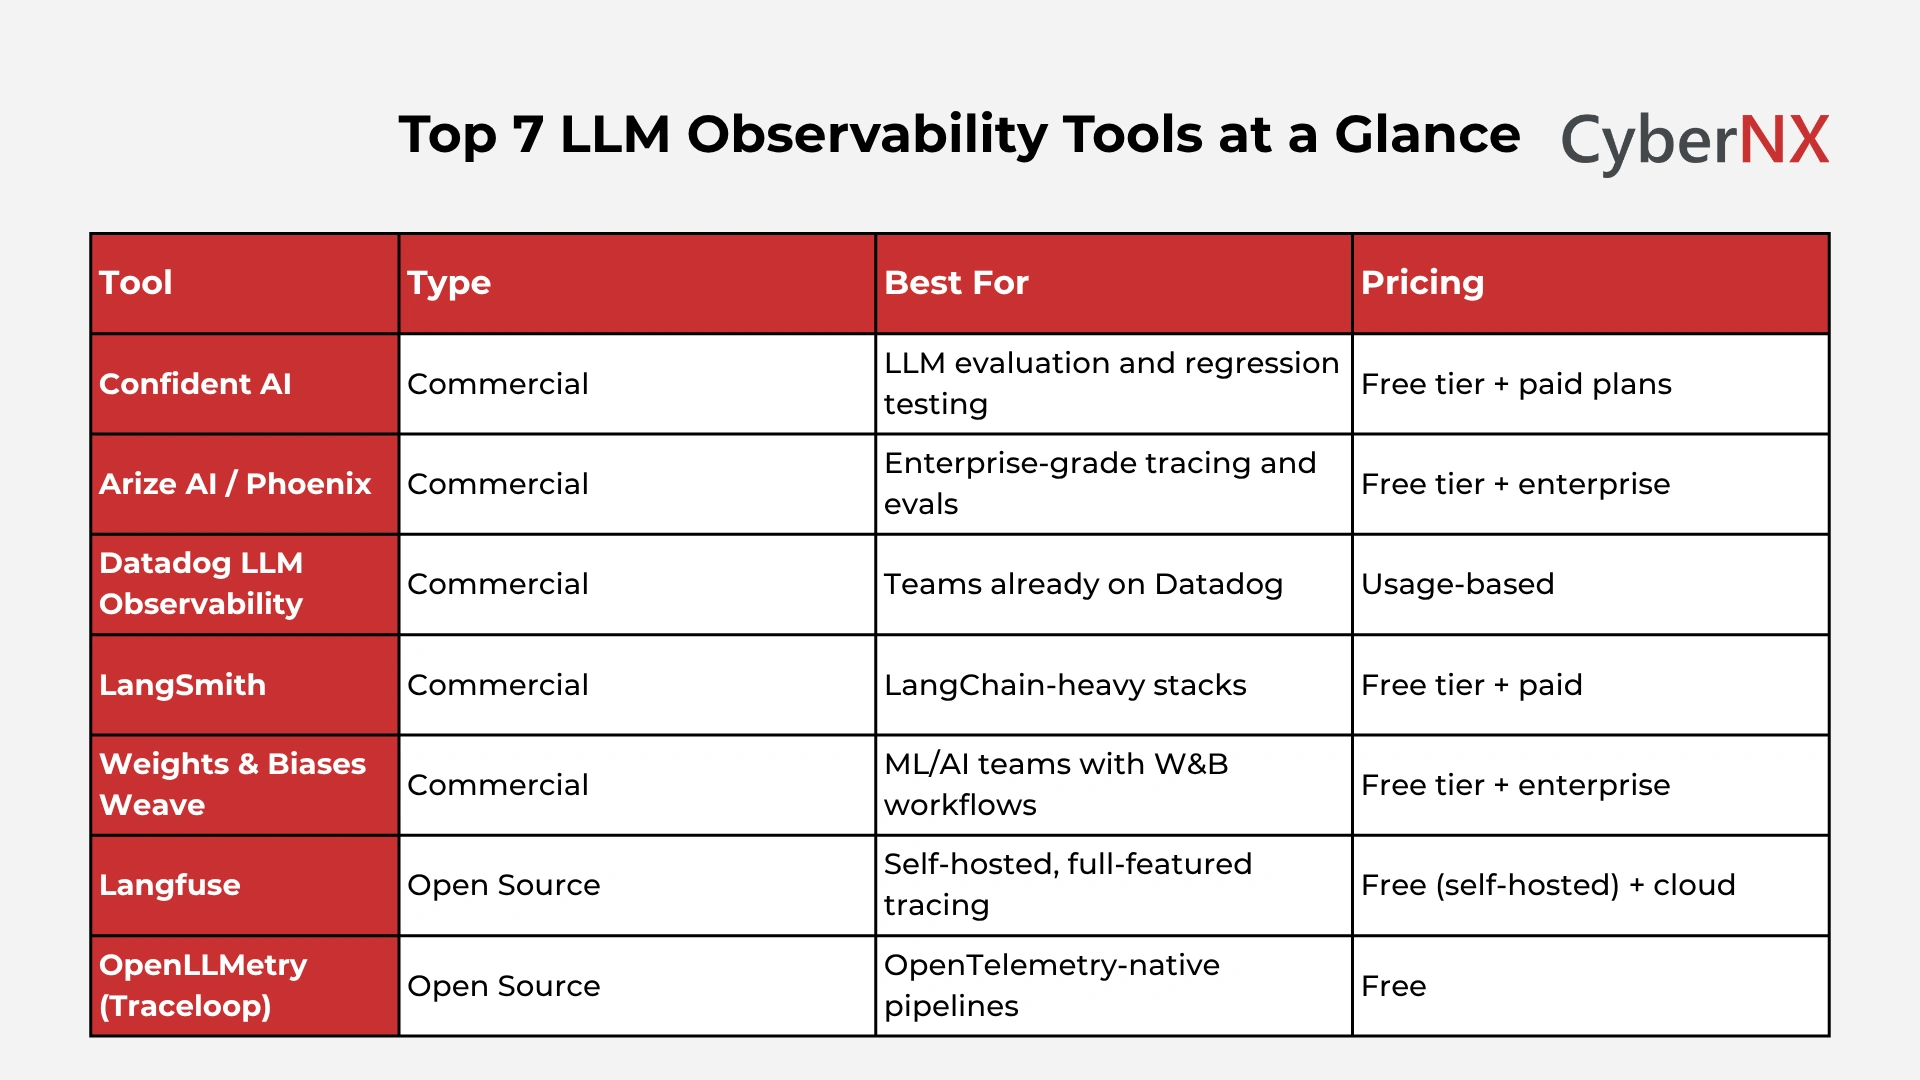
In this post, we break down the top 7 LLM observability tools (5 commercial & 2 open source) with honest assessments of features, ideal use cases and real limitations. This guide will help you pick the right tool for your stack.
What are LLM observability tools?
Let’s begin with definition. LLM observability tools are platforms that help engineering and AI teams monitor, trace, evaluate and debug Large Language Model applications in real time. They capture everything happening between a user’s prompt and the model’s response. This includes intermediate steps, tool calls, token usage, latency and output quality.
Think of them as the APM (Application Performance Monitoring) layer purpose-built for AI. Traditional monitoring checks if a service is up. LLM observability goes deeper to tell you what the model said, why it said it and whether it should have.
Top 7 LLM observability tools compared
Top 5 commercial LLM observability tools
Here are the top 5 LLM observability tools reviewed by our experts.
1. Confident AI
Confident AI is a purpose-built LLM evaluation platform focused on helping teams measure and improve the quality of their AI outputs systematically. Unlike tools that emphasise tracing, Confident AI leads with evaluation — giving you a structured way to define what “good” looks like and test against it.
Key features:
- DeepEval integration: Confident AI powers the popular open-source DeepEval testing framework, letting you run unit-test-style evaluations on LLM outputs
- Regression testing: Automatically compare model outputs across versions so you catch quality degradation before it hits production
- Custom metrics: Define your own evaluation criteria beyond generic quality scores
- Dataset management: Store, version and reuse test cases and golden datasets
- CI/CD integration: Plug evaluations into your deployment pipeline for continuous quality gating
- Hallucination and RAG metrics: Built-in metrics for faithfulness, answer relevancy and context precision in Retrieval-Augmented Generation (RAG) pipelines
Best for: Teams building RAG-based applications or AI agents who need rigorous, reproducible evaluation – not just logging. Particularly strong for teams that want to treat LLM quality like software quality.
Disadvantages:
- Less focused on real-time production tracing compared to tools like LangSmith or Langfuse
- Smaller ecosystem and community compared to more established platforms
- Evaluation-first approach may feel heavy for teams at early experimentation stages
2. Arize AI / Phoenix
Arize AI is one of the most mature platforms in the LLM observability space. It offers both a fully managed cloud platform (Arize) and an open-source tracing and evaluation library called Phoenix. The combination makes it a strong choice for enterprise teams who want depth without sacrificing flexibility.
Practitioners on community forums consistently highlight Arize’s evaluation depth and multi-model support as standout strengths – particularly for teams running complex, multi-step agent pipelines.
Key features:
- Full-stack tracing: Trace LLM calls, tool use, retrieval steps and agent decisions in one unified view
- LLM evals: Run pre-built and custom evaluations at scale including hallucination detection, toxicity scoring and relevance checks
- Phoenix (open source): A local, open-source version for teams who need on-prem visibility without sending data to the cloud
- Drift monitoring: Detect when model behaviour shifts over time compared to a baseline
- Multi-model support: Works with OpenAI, Anthropic, Cohere, open-source models and more
- Integrations: LangChain, LlamaIndex, DSPy and OpenTelemetry-compatible pipelines
Best for: Enterprise AI teams running production-grade LLM applications who need both tracing depth and evaluation rigour – especially those with compliance constraints that benefit from Phoenix’s self-hosted option.
Disadvantages:
- The full Arize platform can feel complex to configure for smaller teams
- Pricing scales quickly at high request volumes
- Phoenix (open source) requires more setup effort than a managed SaaS alternative
3. Datadog LLM Observability
Datadog LLM Observability extends the platform’s legendary infrastructure monitoring into the AI layer. If your team is already running on Datadog – for APM, logs, infrastructure or security – adding LLM observability is a natural, low-friction extension.
Key features:
- Unified visibility: Correlate LLM traces with underlying infrastructure metrics, logs and APM data in a single pane of glass
- Prompt and response capture: Log full prompt/response pairs with automatic PII scrubbing
- Cluster mapping: Visualise how your LLM traces cluster across topics, helping you understand what users are actually asking about
- Error and latency tracking: Standard Datadog-quality alerting applied to your AI stack
- Cost tracking: Monitor token spend per model, per service and per user
- Evaluation metrics: Score outputs on quality, relevance and safety using built-in and custom metrics
- OOTB dashboards: Pre-built dashboards for LLM performance, cost and reliability
Best for: Engineering teams that are already Datadog customers and want to add LLM monitoring without introducing a new vendor or tool category.
Disadvantages:
- Limited value for teams not already on Datadog – the LLM module alone doesn’t justify the platform cost
- Less LLM-native than purpose-built tools; evaluation depth is narrower
- Can feel overkill for small AI projects; pricing is opaque without a direct quote
4. LangSmith
LangSmith is LangChain’s official observability and evaluation platform. If you’re building with LangChain or LangGraph, LangSmith is the most natural fit – it’s designed from the ground up to trace the exact abstractions those frameworks use.
Community practitioners consistently rate LangSmith highly for the smoothness of its LangChain integration and the quality of its debugging experience. The ability to step through complex chain and agent executions visually is a genuine time-saver.
Key features:
- Deep LangChain/LangGraph integration: Native tracing of chains, agents, tools and retrieval steps without manual instrumentation
- Playground: Re-run and tweak individual traces directly in the UI for fast debugging
- Dataset and evaluation management: Build evaluation datasets from production traces and run automated evals
- Human annotation: Add human feedback scores to traces and build labelled datasets for fine-tuning
- Prompt hub: Manage, version and share prompts across your team
- Multi-project support: Organise traces by project, environment and deployment stage
Best for: Teams building production applications on LangChain or LangGraph who want deep, first-class observability that works out of the box – not as an afterthought.
Disadvantages:
- Tightly coupled to the LangChain ecosystem; less useful for custom or non-LangChain stacks
- Some users report that the UI can feel slow with large volumes of traces
- Advanced features require paid tiers, which can be expensive at production scale
5. Weights & Biases Weave
Weights & Biases (W&B) built its reputation on experiment tracking for machine learning. Weave is its answer to the LLM observability problem – and it benefits from years of experience building tools that ML teams actually use daily.
Key features:
- Call tracing: Log every LLM call with inputs, outputs, metadata and latency automatically
- Evaluations: Run structured evaluations on datasets with scoring functions you define
- Leaderboards: Compare model and prompt versions side-by-side in a familiar W&B interface
- Integration with W&B ecosystem: Connect traces to experiment runs, model versions and artifact lineage
- Multi-framework support: Works with OpenAI, Anthropic, LangChain, LlamaIndex and custom code
- Cost tracking: Token and API cost monitoring across models
Best for: ML and AI teams already using W&B for experiment tracking who want to extend the same workflow into LLM production monitoring – avoiding tool sprawl.
Disadvantages:
- Less mature than some LLM-native tools; Weave is still catching up on certain evaluation features
- Best value only for teams already invested in the W&B ecosystem
- Limited out-of-the-box safety and policy monitoring compared to enterprise-focused platforms
Read our blog on Top 5 AI Observability Tools
Best LLM observability tools – open-source picks
For teams with strict data governance requirements, cost constraints or a preference for self-hosted infrastructure, open source LLM observability tools offer serious capability without sending your data to a third-party cloud.
1. Langfuse
Langfuse is the most feature-complete open source LLM observability tool available today. It offers a fully self-hosted option with near-parity to its managed cloud version — making it a popular choice for regulated industries and privacy-conscious teams. Its active community and rapid development cadence set it apart from other open-source alternatives.
Key features:
- Tracing: Capture the full execution tree of LLM calls, chains and agents with nested spans
- Scoring and evaluations: Model-based, rule-based and human feedback scoring on individual traces
- Prompt management: Version, deploy and track prompts directly from the Langfuse UI
- Dataset management: Build and version evaluation datasets from production traffic
- Cost and token tracking: Per-trace and aggregate spend monitoring across providers
- Self-hosting: Deploy via Docker or Kubernetes on your own infrastructure; full data sovereignty
- Integrations: LangChain, LlamaIndex, OpenAI SDK, Anthropic, Vercel AI SDK and more
Best for: Teams that need full-featured LLM observability with complete data control — ideal for financial services, healthcare or any organisation with strict data residency requirements.
Disadvantages:
- Self-hosted setup requires DevOps effort to maintain and scale
- Some advanced features are cloud-only on the managed tier
- Community support only on the self-hosted free plan; enterprise support is paid
2. OpenLLMetry by Traceloop
OpenLLMetry is an open-source observability framework built on top of OpenTelemetry (OTel) – the industry standard for distributed tracing. If your organisation already has an OTel-based observability stack, OpenLLMetry is the most natural way to extend it to cover LLM calls.
Key features:
- OpenTelemetry-native: Emits standard OTel spans and traces, compatible with any OTel backend (Jaeger, Grafana, Datadog, New Relic, etc.)
- Auto-instrumentation: One-line setup to instrument LangChain, LlamaIndex, OpenAI, Anthropic, Cohere and more
- Zero vendor lock-in: Send traces to whichever backend you already use
- Semantic conventions: Consistent, standardised attribute naming for LLM spans
- Broad framework support: Covers most major LLM SDKs and orchestration frameworks out of the box
Best for: Platform and infrastructure teams who want to add LLM observability to an existing OpenTelemetry pipeline without introducing a new backend or data store.
Disadvantages:
- No built-in UI = you need a separate backend (Grafana, Jaeger, etc.) to visualise traces
- Evaluation and scoring capabilities are minimal compared to purpose-built tools
- Relies on the OTel ecosystem, which can have a steep learning curve for teams new to distributed tracing
Conclusion
As AI applications move deeper into production, powering customer support, financial workflows and healthcare decisions, the ability to trace, evaluate and govern model behaviour is as critical as any security control.
There is no single best tool, only the right fit for your stack, your team and your compliance requirements.
But visibility into your LLM stack is only one piece of the puzzle. True AI resilience requires full-stack observability across your models, infrastructure, APIs and your data pipelines.
CyberNX’s Full Stack Observability Solutions give you unified visibility across your entire technology landscape so you can catch failures, detect anomalies and respond fast, whether they originate in your AI layer or anywhere else in your stack.
Ready to see your entire stack clearly? Talk to our team and explore how Full Stack Observability can work for your organisation.
LLM observability tools FAQs
What are LLM observability tools?
LLM observability tools are platforms that monitor, trace and evaluate the behaviour of Large Language Model applications in real time. They capture prompt-response pairs, latency, token usage, evaluation scores and errors – giving engineering teams the visibility they need to debug, optimise and govern AI systems in production.
What is the difference between LLM monitoring and LLM observability?
LLM monitoring tracks metrics – is the system up, how fast is it responding, how much is it costing? LLM observability goes deeper: it captures the internal state of the system, letting you understand why something went wrong, not just that it went wrong. Observability includes tracing, evaluation, prompt inspection and behavioural analysis.
Are there free or open source LLM observability tools?
Yes. Langfuse and OpenLLMetry (by Traceloop) are both fully open source and free to self-host. Langfuse also offers a free managed cloud tier. Several commercial tools including LangSmith, Arize Phoenix and Confident AI offer free tiers for smaller usage volumes.
Which LLM observability tool is best for enterprise use?
For enterprise teams, Arize AI, Datadog LLM Observability and Langfuse (cloud or enterprise self-hosted) are the strongest options. Each offers robust access controls, scalability and compliance-friendly configurations. The best choice depends on your existing stack – Datadog for infra-first teams, Arize for AI-first teams and Langfuse for teams prioritising data sovereignty.