Picking the right observability tool is hard. The market is crowded and every vendor claims to do everything.
Our team has hands-on experience with most tools on this list. After thorough discussions with security practitioners and engineering peers, we put together this guide to help you cut through the noise. Whether you’re running a cloud-native stack or managing a hybrid environment, this list gives you a clear, experience-backed starting point.
A quick look at full stack observability
Full stack observability means having complete visibility into every layer of your environment. It ranges from infrastructure and application code to user experience and security events. It ties together logs, metrics and traces into a single, coherent picture.
If you want a deeper breakdown of the concept, read our full stack observability guide before diving into the tools.
What to look for in an observability tool
Not all observability platforms are built the same. Before you evaluate any tool, it helps to know what actually matters for your environment.
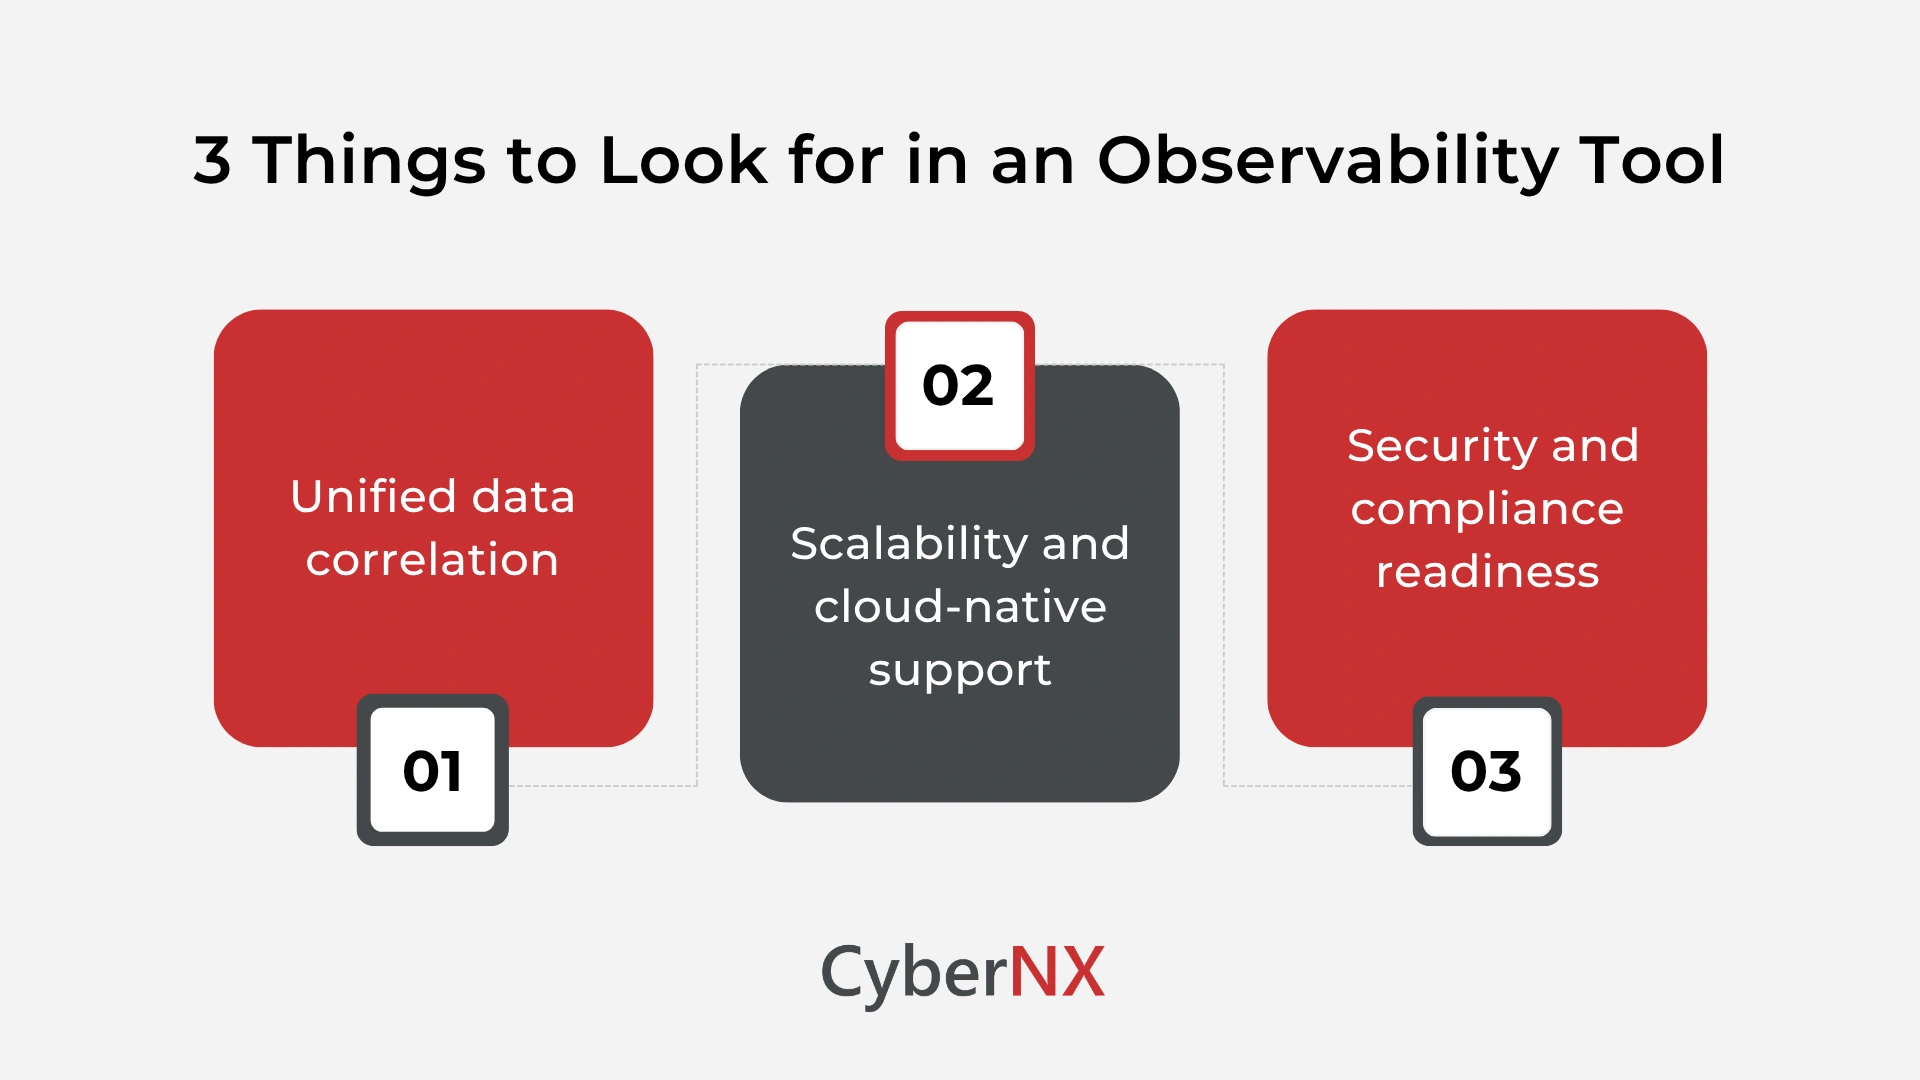
1. Unified data correlation
The best tools don’t just collect data – they connect it. Look for platforms that correlate logs, metrics and traces in a single view, so your team can trace a user request from browser to database without switching dashboards.
2. Scalability and cloud-native support
Your observability platform needs to grow with you. Prioritise tools that support Kubernetes, containerised workloads and dynamic infrastructure out of the box. According to the CNCF Annual Survey, over 84% of organisations now run Kubernetes in production – your tooling should be ready for that reality.
3. Security and compliance readiness
Observability isn’t just a DevOps concern. Your security team depends on the same telemetry data to detect anomalies, investigate incidents and meet compliance requirements. Choose tools that support role-based access, audit logging and integrations with your Security Operations Centre (SOC) workflow.
Top 7 full stack observability tools
Here is our curated list, ordered by overall capability, ecosystem strength and real-world usability across security and engineering teams.
1. Elastic Observability
Elastic Observability is our top pick and for good reason. Built on the Elastic Stack (Elasticsearch, Logstash and Kibana), it brings logs, metrics, traces and uptime monitoring into one unified platform.
What sets Elastic apart is its open architecture. You’re not locked into proprietary agents. It supports OpenTelemetry natively, integrates with hundreds of data sources and scales from small teams to enterprise-grade deployments. Security teams benefit from Elastic’s tight integration with Elastic SIEM, making it one of the few platforms where observability and security detection share the same data layer.
Elastic is also flexible on deployment – cloud, on-premise or hybrid – which matters for organisations with strict data residency requirements.
Best for: Teams that want a unified observability and security platform with open standards support.
2. Datadog
Datadog is one of the most widely adopted observability platforms in the market. It offers deep visibility across infrastructure, applications, logs and user experience – all from a single pane of glass.
Its strength lies in breadth. Datadog supports over 700 integrations, making it easy to connect to almost any tool in your stack. Its AI-powered anomaly detection and alert correlation reduce alert fatigue – a real problem for engineering and security teams managing high-volume environments.
The trade-off is cost. Datadog’s pricing scales with data volume and can become expensive quickly for large environments. Budget-conscious teams should model costs carefully before committing.
Best for: Mid-to-large engineering teams that want broad integration coverage and AI-assisted monitoring.
3. Dynatrace
Dynatrace takes a different approach – it uses AI (its proprietary Davis AI engine) to automatically map your entire environment, detect anomalies and pinpoint root causes without manual configuration.
This makes Dynatrace particularly powerful for complex, highly dynamic environments where manual instrumentation would be impractical. It covers full stack observability from cloud infrastructure down to real user monitoring, and its causal AI reduces the time your team spends triaging alerts.
For security teams, Dynatrace’s runtime application security module adds a layer of vulnerability detection directly within the observability workflow – a meaningful advantage for teams trying to unify DevOps and security operations.
Best for: Enterprise teams with complex, multi-cloud environments that want AI-driven, automated root cause analysis.
4. New Relic
New Relic offers a comprehensive observability platform with a generous free tier – making it one of the most accessible options for teams getting started. It covers infrastructure monitoring, application performance monitoring (APM), distributed tracing, logs and browser monitoring under one roof.
New Relic moved to a consumption-based pricing model in recent years, which means you only pay for what you ingest. This makes it more predictable for teams with variable data volumes. Its query language (NRQL) is approachable and its dashboards are highly customisable.
It may not have the depth of Dynatrace’s AI or Elastic’s security integration, but for teams that want a solid, full-featured platform without a steep learning curve, New Relic is a strong contender.
Best for: Teams looking for an accessible, cost-transparent observability platform with a broad feature set.
5. Grafana + Prometheus
Grafana and Prometheus together form the backbone of observability for a large portion of the cloud-native community. Prometheus handles metrics collection and alerting; Grafana handles visualisation – and together they cover a significant portion of the observability stack.
The Grafana ecosystem has expanded significantly, now offering Grafana Loki for logs and Grafana Tempo for distributed tracing. This means teams can build a near-complete observability stack using open-source components, with Grafana Cloud available as a managed option.
The learning curve is steeper than commercial alternatives, and you’ll need engineering investment to set up and maintain the stack. But for teams with the skills and the budget constraints, this combination offers unmatched flexibility and zero licensing cost.
Best for: Engineering-led teams with strong DevOps capability that prefer open-source, self-managed observability.
6. Splunk Observability Cloud
Splunk Observability Cloud (formerly SignalFx) is a purpose-built platform for real-time streaming analytics and infrastructure monitoring. Its core strength is speed – it ingests and analyses data at massive scale with minimal latency, making it ideal for environments where milliseconds matter.
Splunk Observability Cloud supports OpenTelemetry natively and integrates deeply with Splunk’s SIEM and security products. For organisations already in the Splunk ecosystem, this integration can significantly reduce the gap between observability and security operations.
Licensing costs are a consideration – Splunk’s pricing has historically been high. But for large enterprises that need enterprise-grade reliability and security integration, it remains a top-tier choice.
Best for: Large enterprises already using Splunk for security who want to unify observability and SIEM under one vendor.
7. CyberNX Full Stack Observability Solutions
We’ve built our observability offering in partnership with Elastic, one of the most capable and open platforms on this list.
What that means for you: you get the full power of Elastic Observability – unified logs, metrics, traces and security telemetry, delivered, configured and managed by a team that understands both engineering and cybersecurity. We handle the complexity, so your team doesn’t have to.
For security teams specifically, our solution brings observability data directly into the security workflow. Anomalies in application behaviour, spikes in infrastructure load and suspicious user activity are all correlated in a single view – giving your SOC the context it needs to respond faster and with more confidence.
On affordability, we understand that enterprise-grade observability may feel out of reach for mid-sized organisations. Our Elastic-powered offering is structured to be cost-efficient with flexible deployment options and a pricing model designed for teams that can’t absorb the licensing overhead of larger commercial platforms.
Best for: Security-conscious organisations that want observability power with expert implementation, ongoing support and an affordable model.
How to choose the right tool for your team
The right observability platform depends on more than features – it depends on your team’s maturity, your stack’s complexity and your budget reality.
1. Start with your stack complexity
If you’re running a monolith or a small microservices setup, a lightweight open-source stack like Grafana + Prometheus may be sufficient. If you’re managing dozens of services across multiple clouds, you’ll benefit from a platform with auto-discovery and AI-assisted correlation – like Dynatrace or Elastic.
2. Factor in your budget and scale
Commercial platforms offer faster time-to-value but carry licensing costs that grow with data volume. Open-source tools are free but require engineering time to maintain. Be honest about your team’s capacity to manage infrastructure before choosing a self-hosted solution.
3. Don’t overlook security visibility
Observability and security are converging. The best platforms give your security team access to the same telemetry your engineers use – reducing silos and improving incident response times. If your organisation has a SOC or compliance requirements, factor security integration into your evaluation from day one.
Conclusion
Full stack observability is the foundation of reliable, secure and scalable engineering today. The tools on this list represent the strongest options available today, from open-source flexibility to enterprise-grade AI automation.
The right choice depends on your team, your stack and your security requirements. If you’re unsure where to start, you don’t have to figure it out alone.
At CyberNX, we offer full stack observability solutions, combining deep technical capability with security-first thinking and an affordable delivery model built for real organisations. Talk to our team to build the right observability setup for your environment. Have questions? We’re happy to help you evaluate your options.
Full stack observability tools FAQs
What is the difference between monitoring and observability?
Monitoring tells you when something is wrong – it alerts you to known failure states. Observability goes further: it gives you the ability to understand why something went wrong, even for issues you didn’t anticipate. Observability relies on rich telemetry (logs, metrics and traces) to let you ask new questions of your system without deploying new instrumentation.
Which observability tool is best for cloud-native environments?
Elastic Observability, Datadog and Grafana + Prometheus all have strong cloud-native support. Elastic is particularly well-suited for teams that also need security visibility. Grafana + Prometheus is the go-to for Kubernetes-native teams that prefer open-source tooling.
How does full stack observability help with threat detection?
Observability data – especially correlated logs and traces – gives security teams the context they need to detect anomalous behaviour early. Unusual spikes in API calls, unexpected data flows or failed authentication patterns all show up in observability data before they escalate into incidents. Platforms like Elastic that integrate observability with SIEM make this connection seamless.
Is full stack observability affordable for mid-sized teams?
Yes – with the right approach. Open-source tools like Grafana and Prometheus have no licensing cost, though they require engineering effort to maintain. Managed offerings like CyberNX’s Elastic-powered solution are structured to make enterprise-grade observability accessible without the overhead of a large commercial contract. The key is matching the platform to your scale and support capacity.