Vulnerability exploitation has overtaken every other entry point into corporate networks. It is now responsible for 31% of all initial access in breaches, according to Verizon’s 2026 Data Breach Investigations Report, a 55% jump from the year before. Attackers are not getting in through just clever social engineering. They are walking through unpatched doors that security teams already knew about.
That is what vulnerability management metrics are for. They turn a pile of scan results into a clear answer to a simple question: is your security posture actually improving, or does it just feel that way?
This guide covers the core vulnerability management metrics worth tracking, why Indian companies face more pressure to measure them well, and a practical process to build a good reporting model.
What are vulnerability management metrics?
Vulnerability management metrics are the measurements that turn raw scan data into a clear picture of security performance. Instead of a spreadsheet full of CVE numbers, these metrics tell you how fast vulnerabilities get fixed, which systems carry the most risk and whether your program is improving over time.
When used well, they can support three things: internal accountability, resource prioritisation and audit readiness. But if used poorly, they become vanity numbers that look busy but say nothing about actual risk reduction.
Why vulnerability management metrics matter for Indian enterprises
Banks, NBFCs and other regulated entities in India operate under strict frameworks that expect structured, demonstrable vulnerability management. The RBI Master Direction on Information Technology Governance, the SEBI Cybersecurity and Cyber Resilience Framework (CSCRF) and CERT-In’s technical guidelines all push regulated entities to have structured vulnerability management process and evidence that identified flaws were properly addressed.
The stakes are financial too. The average time to identify and contain a breach globally sits at 241 days, and breaches that take longer than 200 days to contain cost extra millions than those caught early. Metrics are what let a security team catch problems inside that window – instead of after it closes.
For compliance teams, metrics also do double duty. The same MTTR or SLA compliance data used to run the program internally becomes the evidence pack for an auditor or regulator asking for proof.
Key KPI metrics for vulnerability management
A short list of KPI metrics for vulnerability management, tracked consistently, tells you more than a long list tracked occasionally. Some of the most useful ones include:
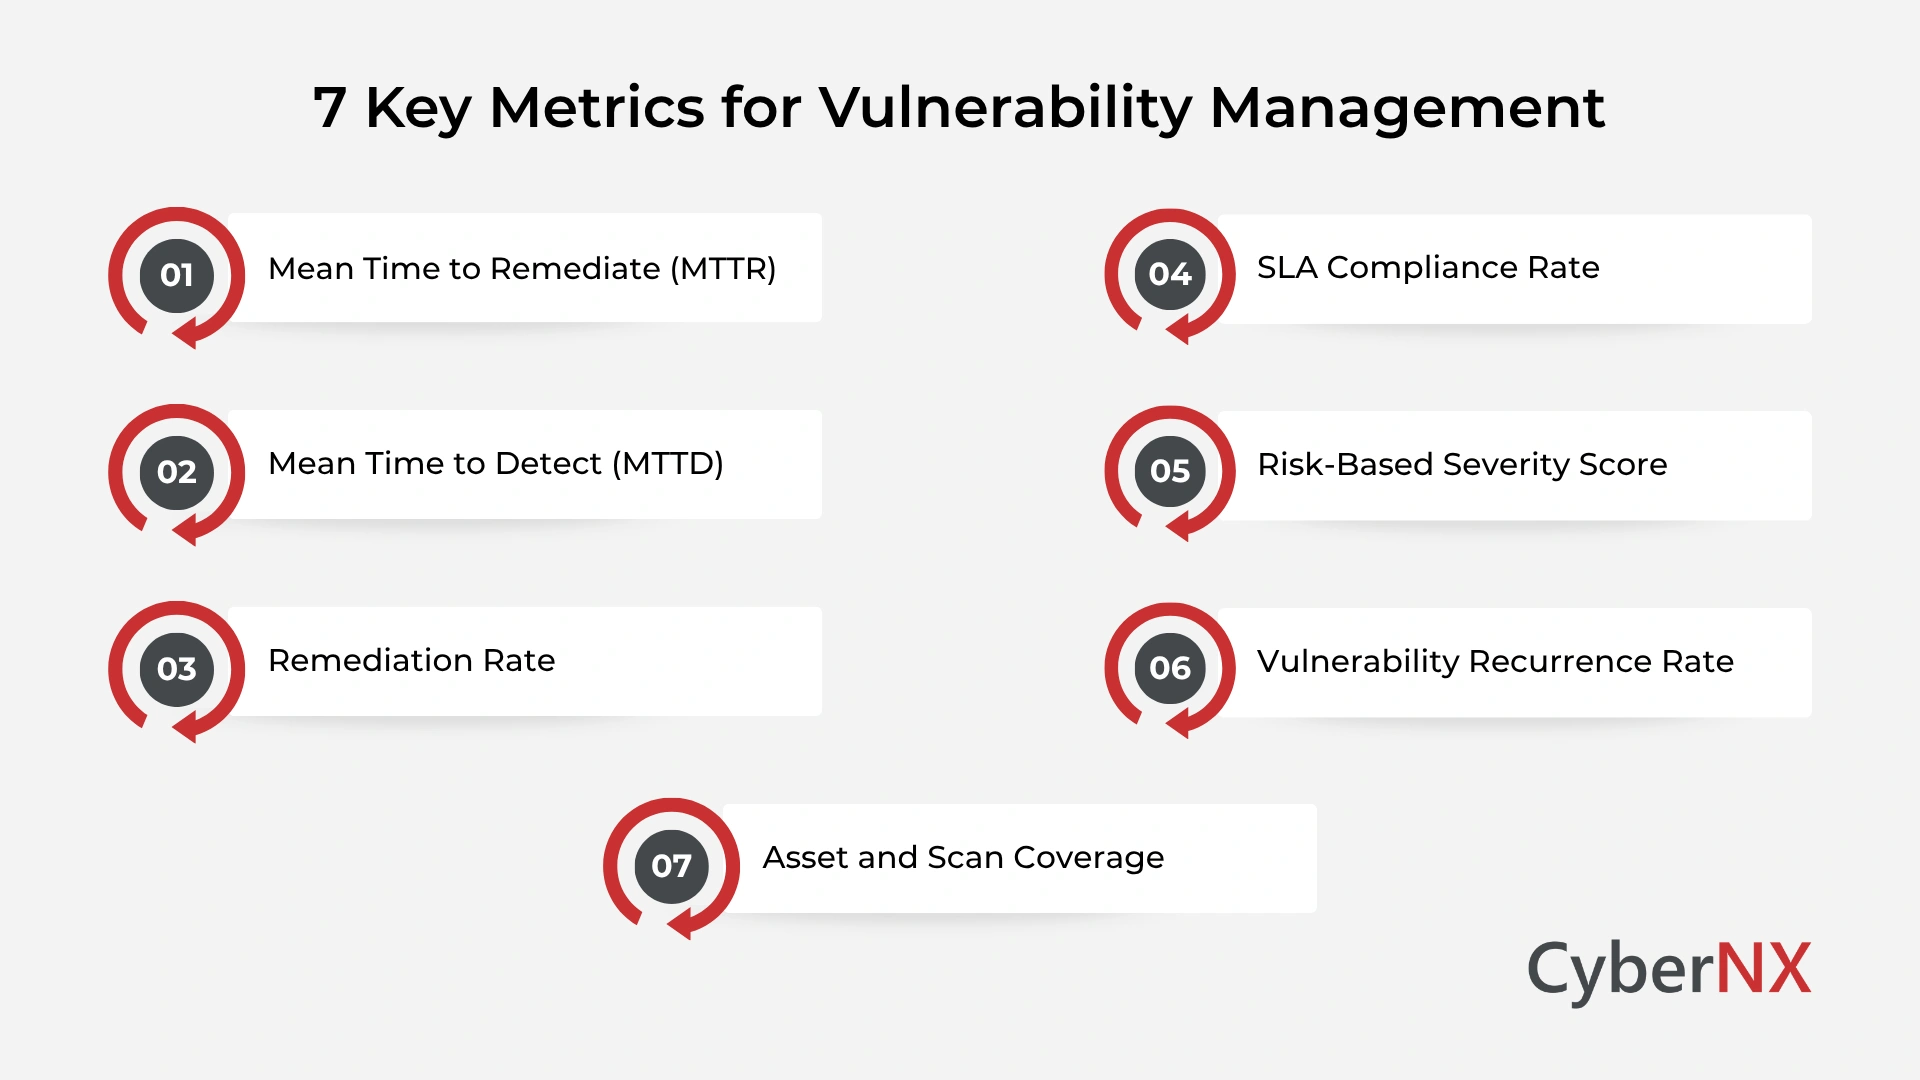
- Mean Time to Remediate (MTTR): The average time between finding a vulnerability and closing it. This is the single clearest signal of program speed.
- Mean Time to Detect (MTTD): How quickly your scanning and monitoring show a new vulnerability after it appears.
- Remediation Rate: The percentage of identified vulnerabilities fixed within a set period, usually tracked weekly or monthly.
- SLA Compliance Rate: The share of vulnerabilities remediated within your internal or regulatory timelines, split by severity.
- Risk-Based Severity Score: A score that blends CVSS ratings with business context, such as whether the affected asset holds customer data.
- Vulnerability Recurrence Rate: How often a previously fixed vulnerability reappears, often a sign of weak patch management or configuration drift.
- Asset and Scan Coverage: The percentage of your IT estate actively scanned, since a metric is only as good as the coverage behind it.
Tracking these together gives a well-rounded view. Speed metrics like MTTR show operational performance. Coverage and recurrence metrics show whether the underlying process is actually sound.
How to measure vulnerability management effectiveness
Building a reliable measurement process takes a few deliberate steps.
- Build a complete asset inventory: You cannot measure what you have not mapped. Start with every server, application, endpoint and cloud workload in scope.
- Pick metrics tied to business risk: Choose a small set of metrics, MTTR, SLA compliance and coverage are a strong starting point, rather than tracking everything at once.
- Automate data collection: Connect your scanning tools directly to your reporting layer so numbers update continuously instead of during a manual pull once a quarter.
- Set baselines and targets: Decide what “good” looks like for each metric. For example, critical vulnerabilities remediated within 7 days, before you start measuring against it.
- Translate findings for leadership: Convert technical scan output into a short report that shows trend lines, risk reduction and open exposure in plain language.
Conclusion
Vulnerability management metrics turn a stream of scan alerts into a program you can defend, improve and report on with confidence. MTTR, SLA compliance and coverage form a solid starting set, and a set process for collecting and reporting them matters a lot.
For Indian firms working under RBI, SEBI and CERT-In expectations, that consistency is a must. CyberNX can provide consistent and expert-led vulnerability assessment services that are based on the latest threat intelligence – providing you with accurate vulnerability management metrics. If you want to build a remediation program that you can trust, talk to our team of experts.
Vulnerability Management Metrics FAQs
What are the most important vulnerability management metrics to track?
Mean Time to Remediate, SLA compliance rate and asset scan coverage give the clearest combined view of speed, consistency and completeness.
How often should vulnerability management metrics be reviewed?
Critical and high-severity metrics work best reviewed weekly, while overall program metrics like remediation rate and coverage suit a monthly or quarterly cadence.
Which vulnerability management metric matters most for compliance?
SLA compliance rate matters most for regulated entities, since it directly maps to the remediation timelines expected under frameworks like the RBI Master Direction and SEBI CSCRF.
How to measure vulnerability management without a dedicated platform?
Smaller teams can track core metrics manually using a shared spreadsheet fed by scanner exports, though this becomes harder to sustain as asset counts and scan frequency grow.