Your application is down. Customers cannot log in. Internal teams start receiving alerts from different tools at once. Infrastructure appears healthy, yet response times keep rising. Meanwhile, security teams wonder whether the outage is operational or something more serious.
This is the challenge many face today. Modern digital systems are deeply interconnected. Cloud workloads, APIs, containers, third party services and hybrid environments create layers of complexity that traditional monitoring tools struggle to explain. Teams often know something is wrong, but they cannot quickly identify where the problem started or how it spread.
This is where full stack observability becomes essential. A strong full stack observability stack gives organisations visibility across infrastructure, applications, networks and user interactions in one connected view. Instead of isolated alerts, teams gain context. They can trace incidents faster, understand dependencies and improve both performance and security outcomes.
In this guide, we explain what full stack observability means, how it works and how businesses can implement it effectively.
What is full stack observability?
Full stack observability is the ability to understand the internal state of your entire technology environment. This is done by analysing the data your systems generate, from the physical server up to the user’s browser.
The term “full stack” is key here. Observability does not stop at the application layer. It covers your cloud infrastructure, databases, network, third-party services and front-end experience, all in one connected view. The goal is not just to collect data, but to connect signals in a way that helps teams identify root causes quickly.
Think of it as the difference between checking the fuel gauge on your car versus having a full diagnostic system that tells you the engine temperature, oil pressure, tyre health and battery status at once. One gives you a number. The other gives you understanding.
How it differs from traditional monitoring
Traditional monitoring focuses on predefined metrics and static thresholds. For example, teams may monitor CPU usage, server uptime or memory utilisation. While useful, this approach often struggles in dynamic cloud native environments.
Observability takes a broader approach.
Instead of simply reporting failures, observability helps teams investigate why failures happen. It supports deeper analysis across distributed systems where one issue can cascade through multiple services within seconds.
Traditional monitoring asks:
- Is the server running?
- Did response time exceed a threshold?
Observability asks:
- Why did latency increase?
- Which service caused the issue?
- How did the problem affect users?
This shift matters because modern outages rarely originate from a single point of failure.
The three pillars: logs, metrics and traces
Full stack observability is built on three types of data – often called the three pillars. Each serves a distinct purpose.
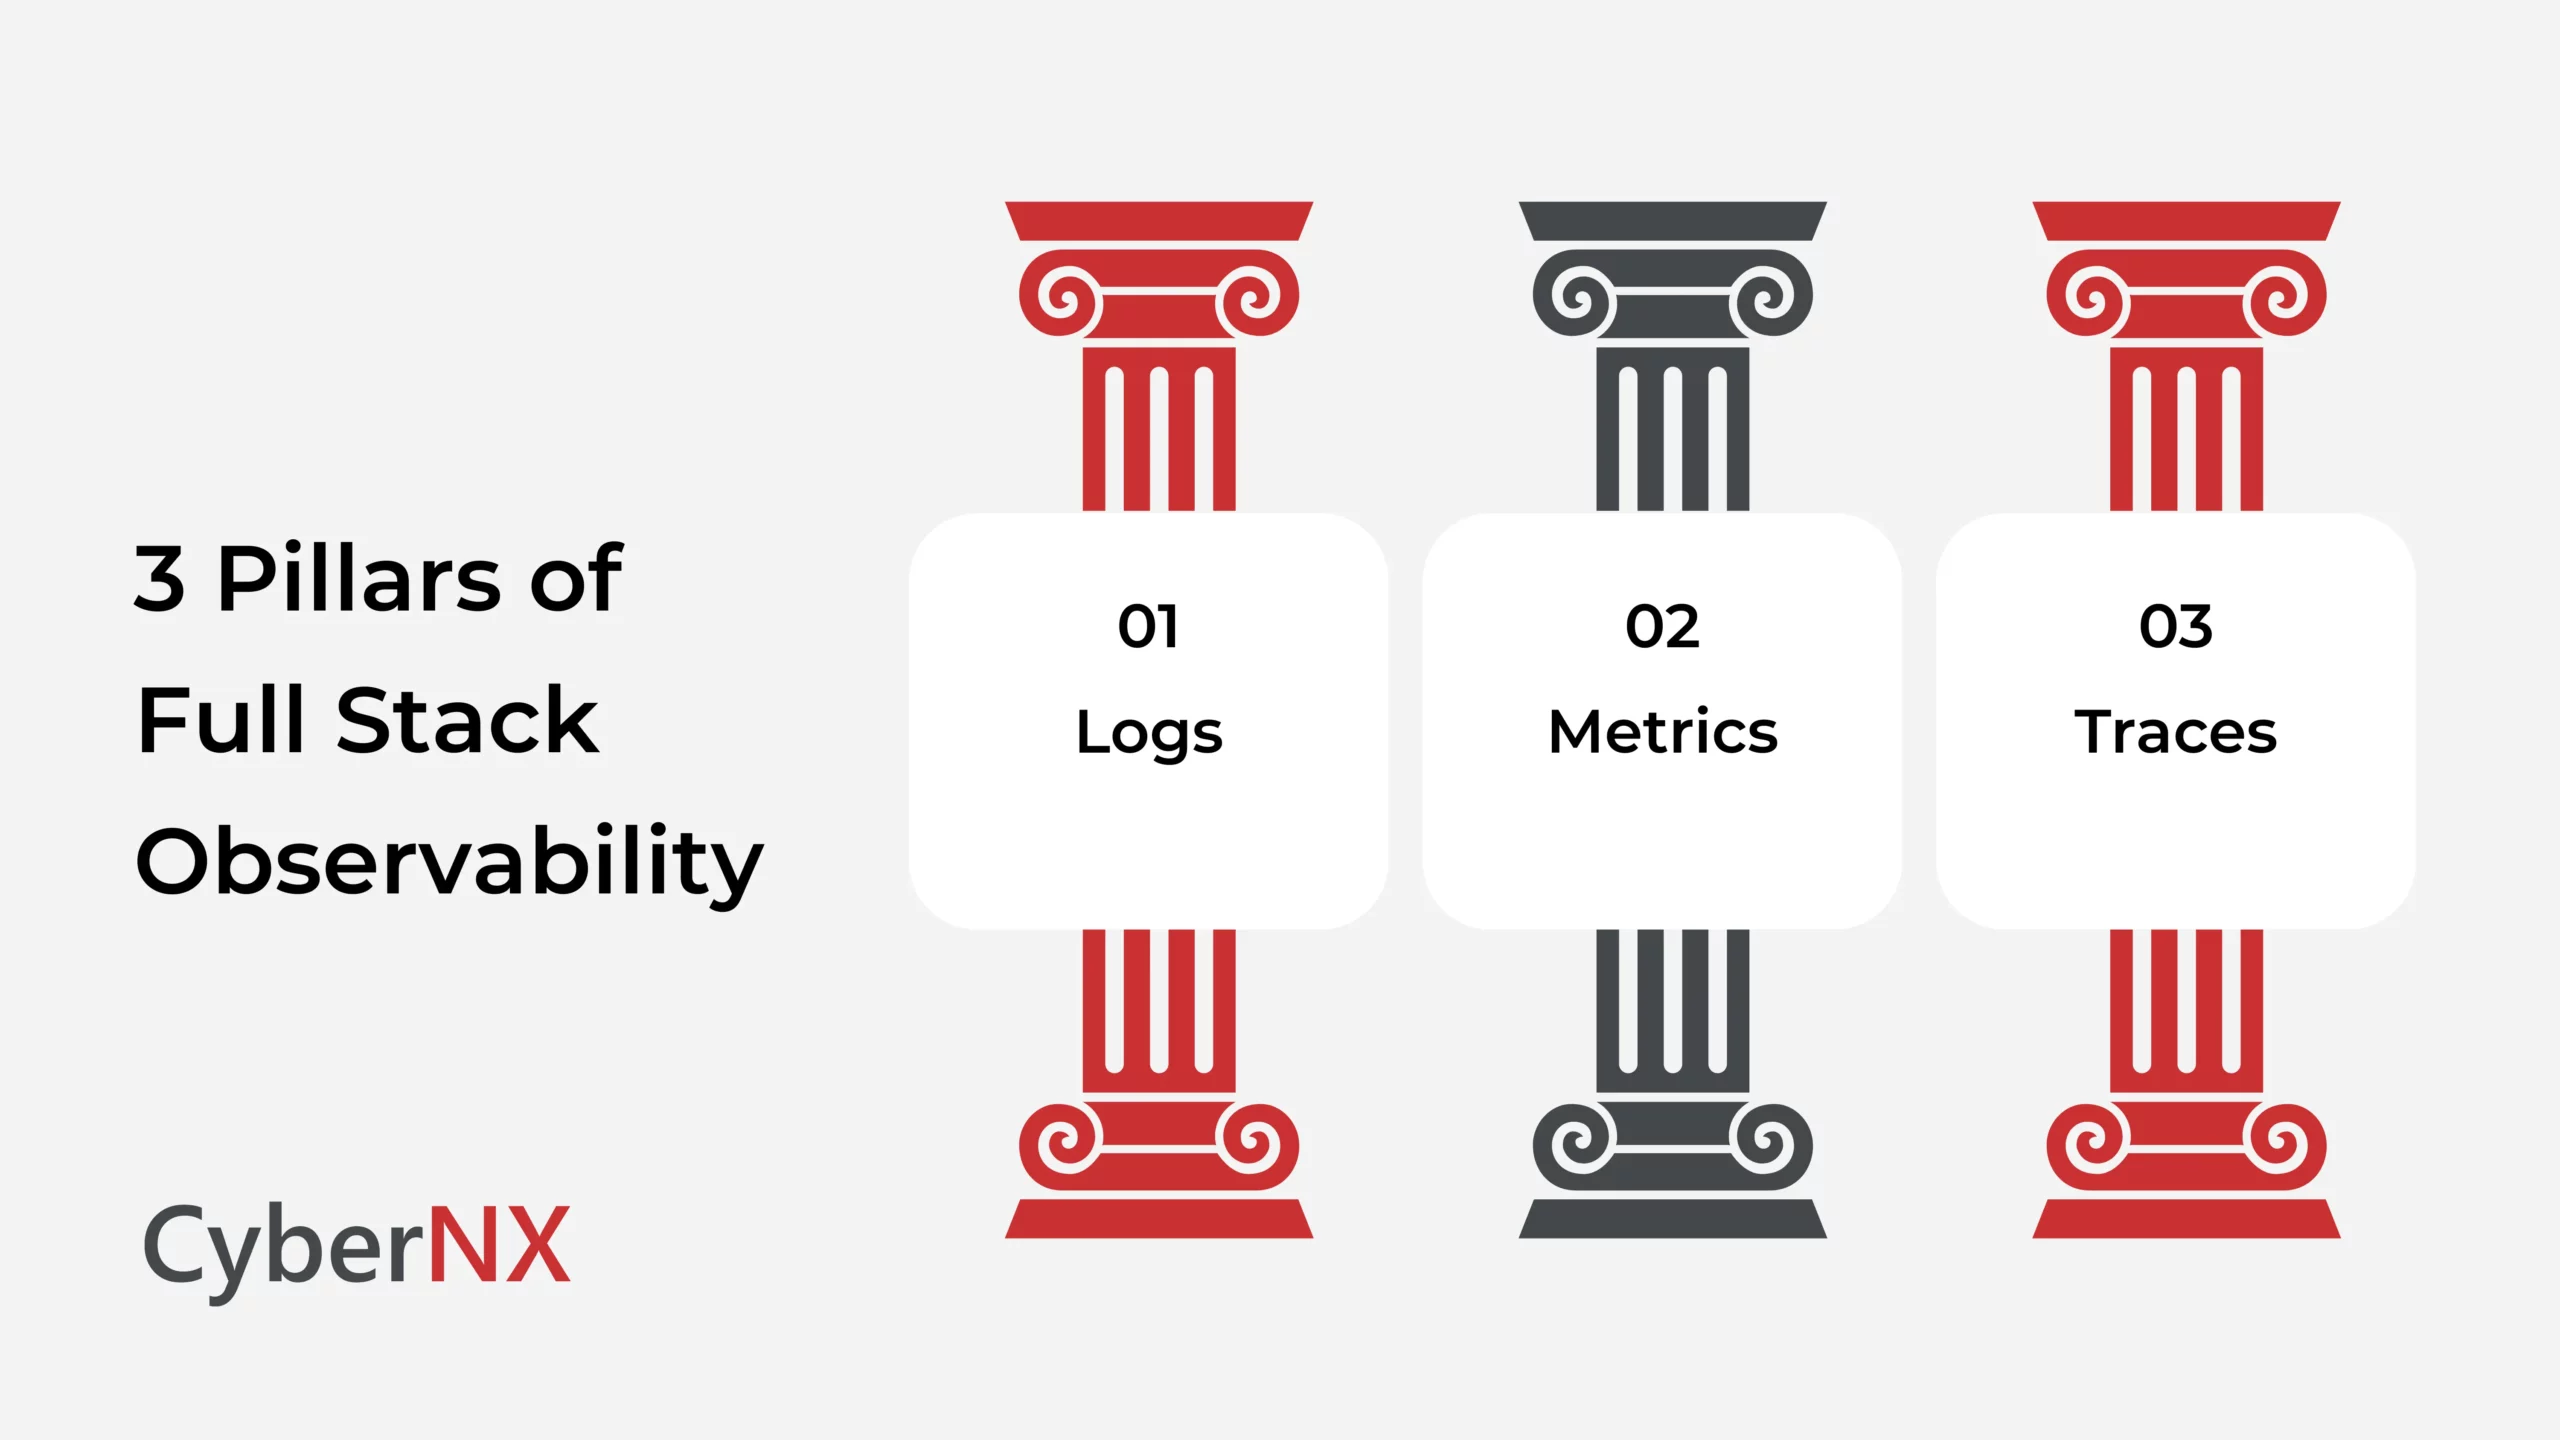
Here is what each pillar does:
- Logs: Timestamped records of discrete events. A user login, an API call, an error message. Logs give you the narrative of what happened.
- Metrics: Numerical measurements over time. CPU usage, memory consumption, request latency. Metrics show you the health of your system at a glance.
- Traces: End-to-end records of a request as it travels through multiple services. Traces show you exactly where time was spent and where failures occurred across your distributed system.
Together, these three pillars let you correlate events, spot patterns and pinpoint the source of any issue quickly.
Why full stack observability matters for modern businesses
The business case for observability is straightforward: you cannot fix what you cannot see. But the stakes go beyond uptime.
According to industry research, the average cost of IT downtime for mid-to-large enterprises can exceed $5,000 per minute. For banks, healthcare providers and e-commerce platforms, the number is far higher – and that does not include reputational damage or regulatory penalties.
Full stack observability is not a nice-to-have. It is a business continuity requirement.
The cost of invisible failures
Most failures do not announce themselves loudly. They start as a slow memory leak in one microservice, a misconfigured API rate limit or an unusual spike in database query times. Without observability, these signals are invisible until they cascade into an outage.
By the time your monitoring tool fires an alert, the problem has already been affecting users for minutes – sometimes hours. The cost is not just the downtime itself. It is the engineering hours spent debugging blind, the customer trust eroded and the compliance exposure created.
How observability reduces mean time to resolution (MTTR)
Mean Time to Resolution (MTTR) is one of the most important metrics in IT operations. It measures how long it takes your team to detect, diagnose and fix a problem after it occurs.
Research from the DORA State of DevOps report consistently shows that elite-performing technology teams resolve incidents in under an hour. Lower performers take days. The difference? Visibility.
With full stack observability in place, your team can:
- Detect anomalies faster: Automated analysis spots deviations before users report them.
- Diagnose root causes in minutes: Distributed traces show exactly which service, database call or API integration caused the failure.
- Restore service with confidence: You can verify the fix is working in real time, across every layer of the stack.
Key components of a full stack observability platform
Building full stack observability means bringing together several capabilities into one coherent system. Here are the core components you need.
1. Infrastructure observability
Infrastructure observability covers the foundational layer: servers, containers, virtual machines, Kubernetes clusters and cloud services.
You need visibility into CPU, memory, disk and network utilisation – but also into the relationships between infrastructure components. How does a Kubernetes pod failure affect your application? How does a cloud availability zone going down cascade to your users? Infrastructure observability answers these questions in real time.
2. Application performance monitoring (APM)
Application Performance Monitoring (APM) sits in the middle of your stack. It tracks how your code behaves in production: response times, error rates, throughput and the performance of individual functions or database queries.
Good APM tools – such as those built on the OpenTelemetry standard – instrument your code automatically and give you a service-level view of your application’s health. OpenTelemetry is an open-source, vendor-neutral framework that standardises how you collect and export telemetry data across your entire stack.
3. User experience and front-end observability
The final layer is the one that matters most to your customers: the front-end experience.
Front-end observability tracks real user interactions – page load times, JavaScript errors, Core Web Vitals, session replays and conversion drop-offs. It closes the gap between what your backend systems report and what your users actually experience.
A backend that reports 99.9% uptime is useless if your JavaScript bundle is blocking the page for five seconds on a mobile device.
How to implement full stack observability in five steps
Implementation does not have to happen overnight. A phased approach lets you build observability incrementally, without disrupting existing operations.
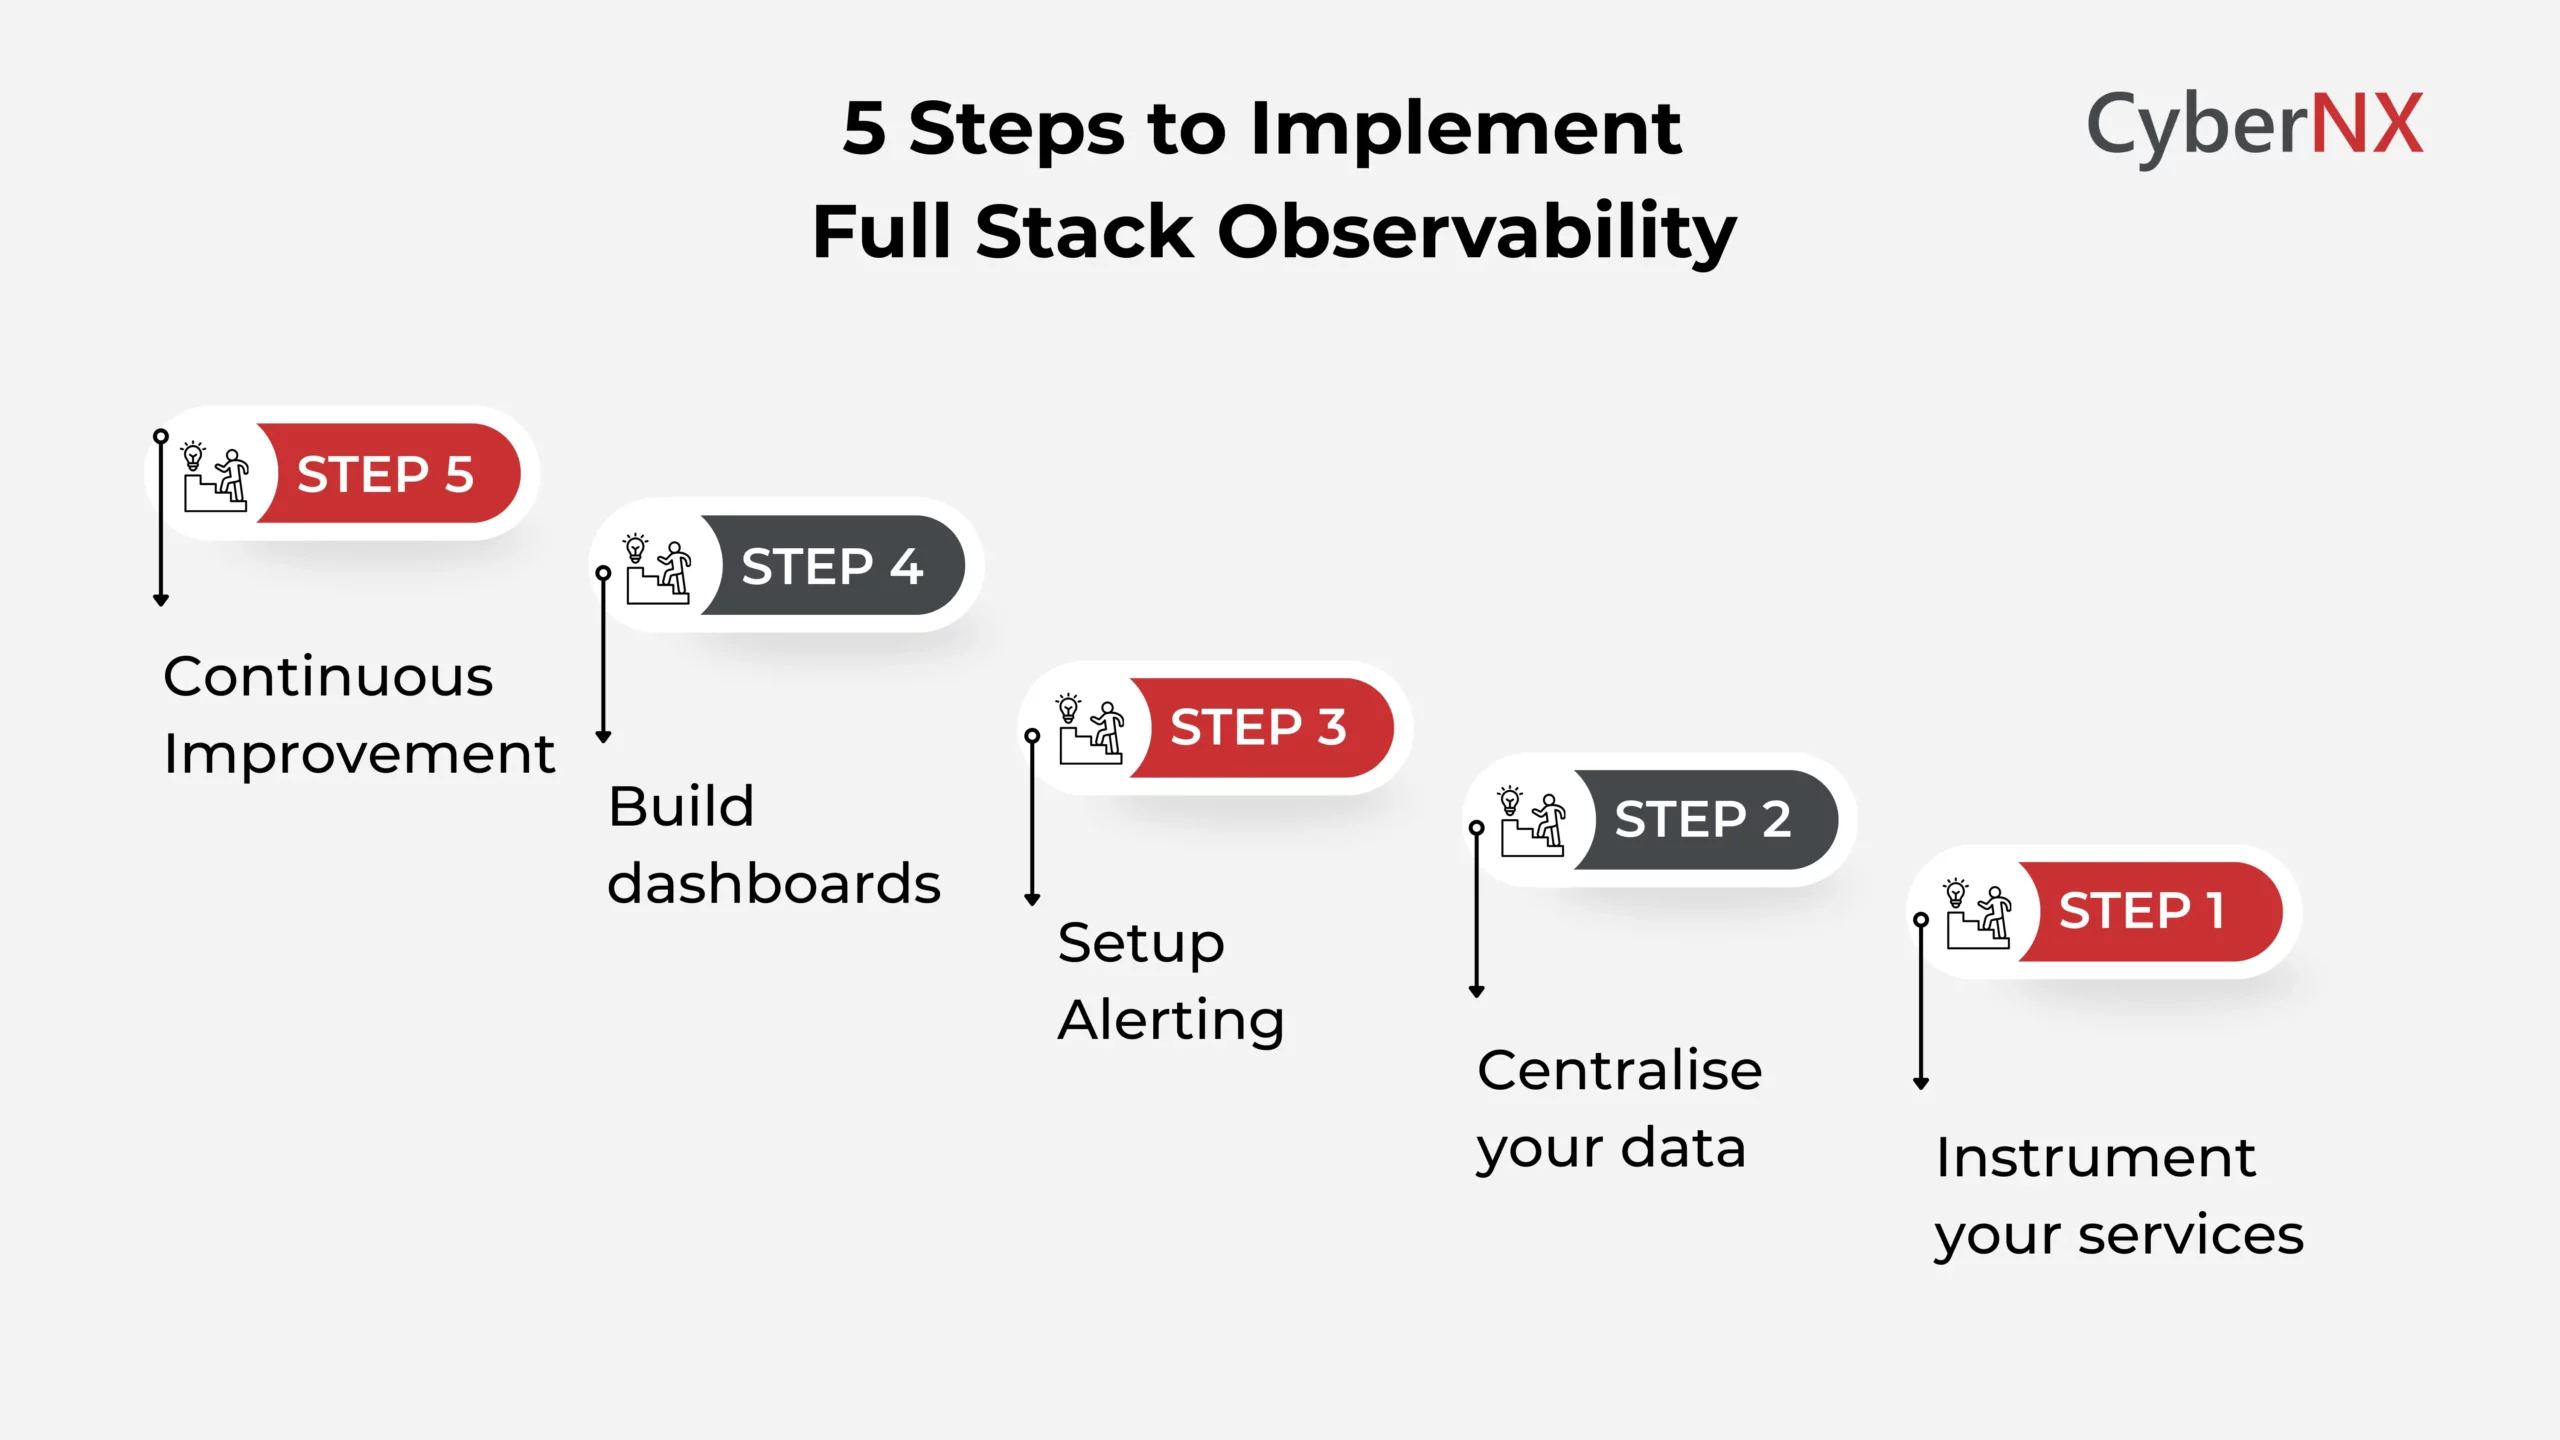
Step 1 – Instrument your services
Start by adding instrumentation to your services using a standard like OpenTelemetry.
Instrumentation is what allows your services to emit logs, metrics and traces. Begin with your highest-priority services – the ones most critical to business operations. Instrument them first, validate the data quality and then expand outward.
Step 2 – Centralise your data
Raw telemetry data scattered across five different tools is not observability. It is noise. Centralise your logs, metrics and traces into a unified observability platform. This is what allows correlation – the ability to see how an infrastructure event connects to an application error that connects to a user-facing problem.
Step 3 – Set up intelligent alerting
Alerts should be meaningful, not just loud. Configure alerting rules based on business impact – not just technical thresholds. Instead of alerting when CPU hits 80%, alert when error rates exceed your SLA threshold or when p99 latency degrades for a critical user journey. Reduce alert fatigue. Make every alert something your team can act on.
Step 4 – Build meaningful dashboards
Dashboards should answer the questions your team asks most often. Build views for different audiences: executive health dashboards, engineering operations dashboards and service-specific deep-dive dashboards. Keep dashboards simple and updated. A cluttered dashboard that nobody trusts is worse than no dashboard at all.
Step 5 – Close the loop with continuous improvement
Observability is not a one-time project. As your systems evolve, your observability coverage must evolve with them. Conduct regular reviews after incidents: what did observability help you find? What did it miss? Use post-mortems to improve your instrumentation, alerting and dashboards continuously.
Full stack observability and cybersecurity
Observability is not just an engineering and operations tool. It is a powerful asset for your security team as well.
1. How observability supports threat detection
Security threats leave traces – unusual login patterns, unexpected API calls, data exfiltration attempts that look like high-volume outbound traffic. These signals live in the same telemetry data your observability platform already collects.
By extending observability to include security-relevant signals, your team can detect threats faster and with more context. Instead of a raw security alert, you get a correlated view: the user account that triggered the alert, the service it accessed, the data it touched and the timeline of events – all in one place.
This is the foundation of a modern security operations approach: connecting your observability data to your Security Operations Centre (SOC) for continuous, context-aware monitoring.
2. Connecting observability to your SOC
A Security Operations Centre (SOC) depends on high-quality, contextual data to detect and respond to threats. Full stack observability dramatically improves that data quality.
When your SOC analysts receive an alert, they should be able to immediately see what was happening across the stack at that moment: which services were active, what data was being accessed and how the affected system connects to the rest of your environment.
This cuts investigation time, reduces false positives and gives your analysts the confidence to act decisively – rather than spending hours piecing together context from disconnected tools.
Conclusion
Modern systems move fast. Unfortunately, failures move faster. A mature full stack observability helps organisations detect issues earlier, resolve incidents faster and strengthen operational resilience across complex environments. By connecting logs, metrics and traces across infrastructure, applications and user experiences, businesses gain the visibility needed to improve reliability and security simultaneously.
Observability also plays an increasingly important role in cybersecurity. Better telemetry leads to stronger detection capabilities, faster investigations and improved response coordination.
At CyberNX, we help organisations build observability driven security operations that support continuous monitoring, rapid detection and operational confidence. Our Full Stack Observability Solutions combine advanced visibility with expert analysis so your teams can respond to threats and outages with greater clarity and speed. Looking to strengthen your visibility and threat detection capabilities? Connect with our team to build a more resilient and secure operational environment.
Full stack observability FAQs
What is the difference between observability and monitoring?
Monitoring tells you when something is wrong – based on thresholds and checks you set in advance. Observability lets you explore why something went wrong, even for problems you did not anticipate. Monitoring alerts. Observability investigates.
What tools are used for full stack observability?
Common platforms include Datadog, New Relic, Dynatrace and open-source stacks built around Prometheus, Grafana and Jaeger. Many teams use OpenTelemetry as a vendor-neutral instrumentation standard to avoid lock-in. The right choice depends on your stack, team size and budget.
Is full stack observability only for large enterprises?
No. While large enterprises were early adopters, full stack observability is increasingly accessible to mid-sized organisations through SaaS platforms with usage-based pricing. Even a small engineering team running microservices on a cloud platform benefits significantly from unified observability.
How does full stack observability relate to DevSecOps?
Full stack observability is a natural enabler of DevSecOps. It gives development, operations and security teams a shared source of truth about system behaviour. Security teams can use observability data to detect threats faster. Developers can catch performance regressions before they reach production. The result is a faster, safer software delivery process.